You’ve probably read that growth stocks have trounced value in recent years. We at the Forecasts discussed the issue in several stories, and other financial-media outlets have written about the same trend. With good reason.
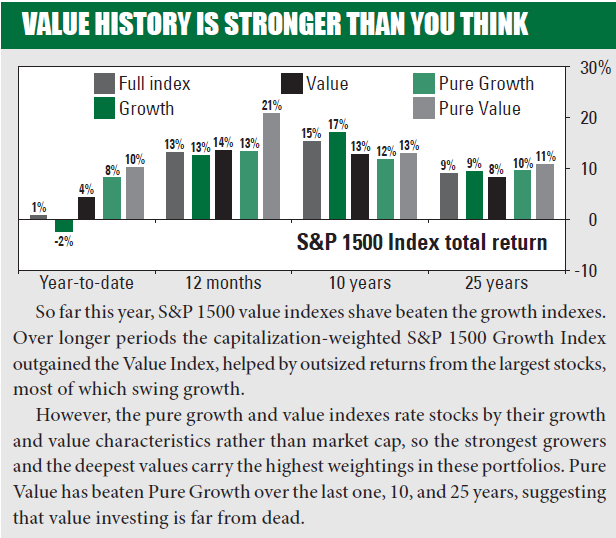
Value is beating growth this year. But, over the last 10 years, the S&P 1500 Growth Index has returned an annualized 17.0%, versus 12.7% for the Value Index. Those numbers imply that a $10,000 investment would have grown to $48,127 in the Growth Index and $32,948 in the Value Index. Growth has also outperformed over the last 25 years ($92,994 versus $72,424).
However, while we acknowledge the power of growth, we have also advised readers not to give up on value investing. The above return comparison, while compelling, does not tell the whole story. Standard & Poor’s also created the Pure Growth and Pure Value indexes, which have charted a different course. Pure value has outperformed pure growth this year — and over the last one, 10, and 25 years, as shown nearby.
The secret sauce
Why the disparity in relative returns between the style indexes and the pure style indexes? The key lies in the methodology. In a box on page 5, we break down the metrics used to compute growth and value scores for stocks in the S&P 1500. While S&P uses those same metrics for both types of index, it selects and weights the stocks differently.
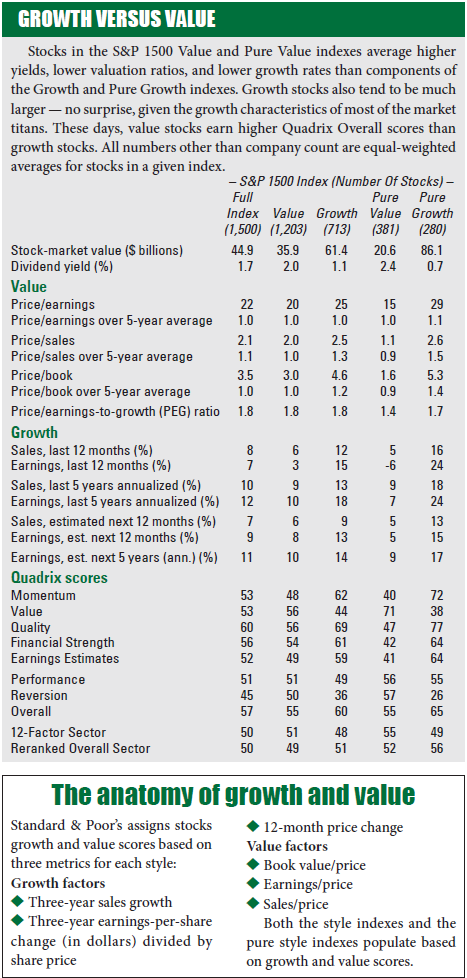
The growth and value indexes are larger, with plenty of stocks (416) qualifying for both. Standard & Poor’s weights these indexes by market capitalization, with the largest stocks comprising the largest index positions.
In contrast, the Pure Growth Index contains 280 stocks and the Pure Value Index 381 because S&P uses a stricter selection process and allows no overlap. Importantly, these indexes are weighted by growth and value score, meaning that the cheapest stocks earn the biggest positions in the Pure Value Index, while the fastest growers have primacy in the Pure Growth Index, with market cap not considered.
Given the impressive performance of the biggest U.S. stocks, most of which lean heavily toward growth, the Growth Index’s dominance over the last decade does not surprise us. However, the Pure Value Index’s superior returns suggest that a focus on value stocks — and even deep value stocks — can still reap rewards.
Not surprisingly, stocks in the Value and Pure Value Index earn higher Quadrix® Value scores than their counterparts in the growth indexes. They also earn lower Momentum and Quality scores, and a look at the valuation ratios and growth rates in the nearby table show why.
Unusual value
We expect value stocks to trade at low valuations and post lower growth rates than growth stocks. However, value stocks are currently cheaper than normal relative to growth.
Components of the growth indexes trade roughly in line with their historical price/earnings ratios and at a premium to historical norms on price/sales and price/book. In contrast, the average value stock trades at a slight discount to historical norms.
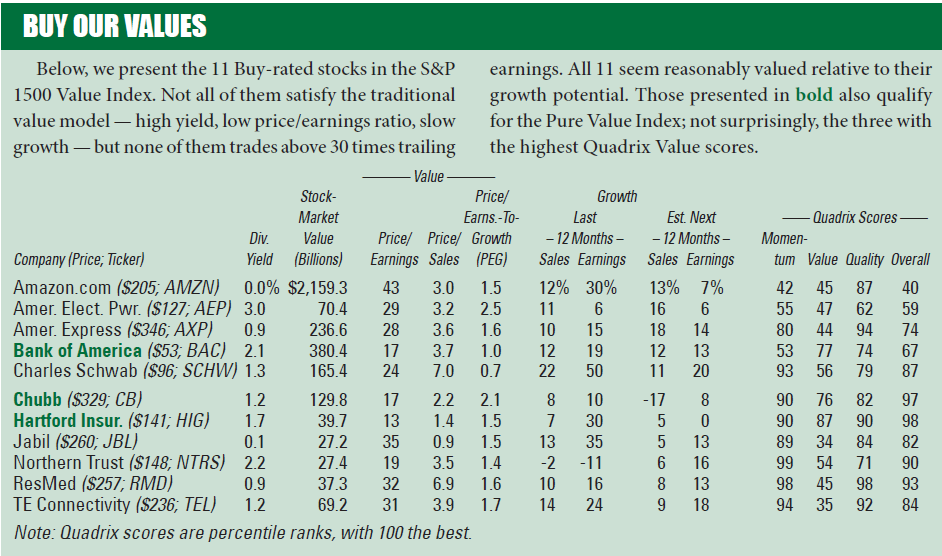
In recent years, our Buy List has leaned toward the growth side, reflecting the fundamental strength of those stocks and capturing some excellent returns. At the moment, stocks in the Value Index average Overall scores of 55, versus 60 for the Growth Index. Several of our recent additions swing value, including American Electric Power ($127; AEP) and Chubb ($329; CB), both of which joined the Buy List in the last two weeks.
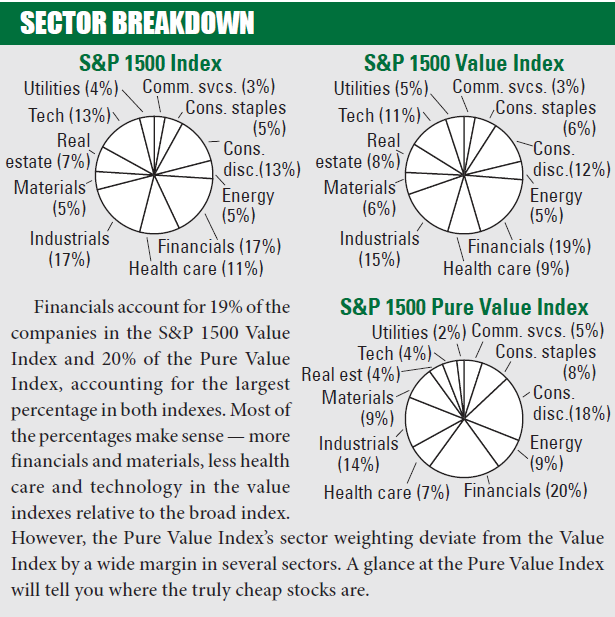
The table below presents Buy-rated stocks that qualify for the S&P 1500 Value Index. Of the 11 stocks, six come from the financials sector.