The science behind our strategy
Build your portfolio with informed data and confidence
We believe no numbers-based ranking system can substitute entirely for company analysis and that stocks cannot be reduced to a series of equations. Often what may really matter about a company’s stock is not on the balance sheet or income statement. For example, Quadrix seeks to tell you which drug companies have done best in growing earnings and sales, but it cannot tell you the companies with the best new drugs in the pipeline. Still, we believe a numerical ranking system like Quadrix can be a great first screen for building portfolios. Because the system uses only quantifiable factors, it is designed to narrow the focus on companies achieving superior results. Similarly, because Quadrix is not influenced by the fear, hope, and greed that can cloud the judgment of many investors, the system is designed to provide unbiased feedback on current portfolio holdings.
Quadrix uses roughly 90 variables to score stocks in seven categories – Momentum, Quality, Value, Financial Strength, Earnings Estimates, Performance, and Reversion. Within each category, some variables are weighted more heavily based on past effectiveness. To compute an Overall Score, Quadrix uses a weighted average of seven category scores, with Value, Quality, and Momentum receiving the biggest weightings. Based on past effectiveness or expectations regarding market conditions, weightings for the individual variables or the categories may change.
Over 90 scoring variables in seven categories
Momentum
Recent growth in earnings, cash flow, and sales.
Value
Price/earnings (P/E), price/sales, price/cash flow, price/book value, and P/E relative to expected growth (PEG).
Quality
Growth rates for sales, earnings, cash flow, book value, and dividends.
Financial Strength
Interest coverage, debt positions, and profit margins.
Earnings Estimate
Trends in analyst estimates.
Performance
Total returns relative to other stocks.
Reversion
Much like the Performance score, Reversion considers total returns.
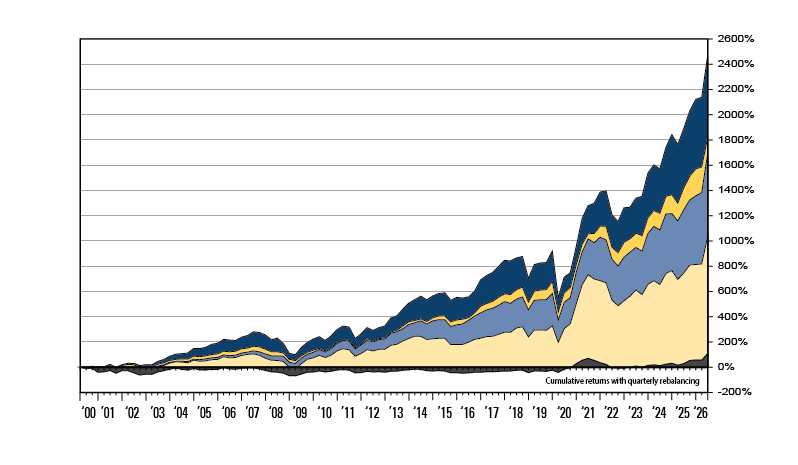
The Quadrix Track Record
Performance of Quadrix’ Overall Score
For all stocks, 2nd Quarter 2000
through 2nd Quarter 2026
Group 1
Scores of 80 to 100 | 2,465.8%
Group 2
Scores of 60 to 80 | 1,818.5%
Group 3
Scores of 40 to 60 | 1,691.1%
Group 4
Scores of 20 to 40 | 1,035.1%
Group 5
Scores of 0 to 20 | 108.2%
Quadrix Variable Examples
Earnings predictability
Seeks to gauge the consistency of earnings growth based on the historical volatility of year-to-year earnings comparisons.
EPS estimate revisions
Change in consensus profit estimates for current and next quarter.
EPS surprise last quarter
Seeks to measure reported earnings versus expectations.
Expected profit growth this year
Seeks to project one-year change in earnings per share.
Interest coverage
Net income before interest and taxes divided by interest expense.
Long-term debt to capital
Long-term debt divided by the sum of debt and equity.
Long-term expected profit growth
Consensus estimates for five-year earnings growth.
Operating profit margin
Operating income before depreciation divided by sales.
Price to book value
Current share price divided by shareholders equity per share.
Price to cash flow
Current share price divided by trailing 12-month cash flow per share.
Price to cash flow versus three-year average
Current share price/cash flow ratio divided by the average of the ratio over the past three years.
Price to earnings (P/E)
Current share price divided by earnings per share.
P/E to estimated five-year EPS growth (PEG)
P/E using current-year estimated earnings divided by expected five-year earnings growth.
Price to sales
Current share price divided by 12-month sales per share.
Return on assets
Net income divided by average annual assets.
Return on equity
Net income divided by average equity.
Total return
The performance of a stock, including both price action and dividends.
Subscriber Testimonials
Dow Theory Forecasts has proven to give realistic evaluations for investments and allows one to plan for a total return approach. The articles are clear and to the point.
Ben Strader – Bradenton, FL
You have provided timely excellent stock picks that have stood the test of time.
Herbert Fisher – Burlingame, CA
I am more successful and disciplined when following the great advice of one source which is Dow Theory Forecasts.
Don Brugge – Mobile, AL
I think Dow Theory Forecasts is very informative, easy to understand, and the stock picks in the portfolios make sense.
David Burkhard – Indianapolis, IN
I am VERY satisfied with the literature, especially Dow Theory's Quadrix system...it's great!
Evan Plisner – Ann Arbor, MI
The stocks I bought by way of your Quadrix scores were the quickest to recover from the market lows.
William J. Hornby – Rosebud, TX
First, let me say, Dow Theory Forecasts is an excellent production. It would be the absolute "last" publication I'd ever drop from my investment list.
Peter Santora – Seneca, SC
Learn more about the Quadrix system and explore the benefits it offers to an investment strategy.