For many investors, the phrase “valuation ratio” translates to “price/earnings ratio.” The financial media cite P/E ratio more often than any other valuation metric, which helps explain why so many individual investors focus on it.
Of course, we cannot blame the P/E fixation entirely on individuals. Analysts and other industry professionals also put more weight on per-share profits than on other operating metrics. When you hear about quarterly “surprises” moving stock prices, the news typically focuses on profits.
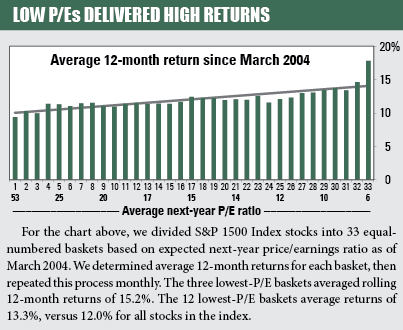
Not that we object to a focus on P/E ratios, because these metrics possess considerable predictive power, as you can see in the chart below.
We divided stocks in the S&P 1500 Index into 33 equal-numbered baskets using three ratios — trailing P/E and P/E ratios based on current-year and next-year profit estimates. For all three ratios, we tracked rolling 12-month returns since 2004 and found stocks with low P/E ratios tended to outperform those with high ratios.
The P/E ratio based on next year’s profit estimate was most effective, with the 12 lowest-P/E baskets (mostly stocks trading below 13.5 times earnings) outperforming the average stock by an average of nearly 1.3%. While the P/E ratio has worked over the long haul, it can be streaky, with long periods of outperformance or underperformance. Some huge gains have boosted average outperformance.
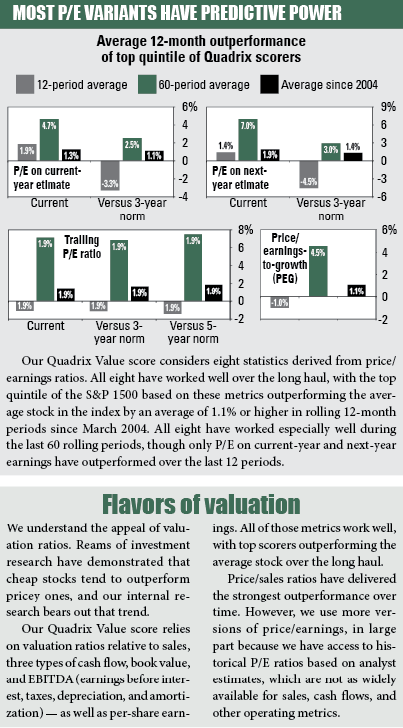
For the other two P/E ratios, the same 12 baskets outperformed by slightly less than 1%. We cannot be sure why the next-year P/E works better than the other ratios. One possible explanation: Current-year P/E ratio starts the year looking forward, but once we get further into the year, it begins to resemble trailing P/E and offers little forward benefit. The next-year P/E always looks at least a year ahead, suggesting it better retains a forward-looking focus.
Going to extremes
Extremely high or low P/E ratios carry the most predictive power. Using next-year P/E ratios, only six of the 33 baskets averaged 12-month returns at least 1% higher than the average for all stocks — the six baskets containing stocks with the lowest ratios. Those baskets contained stocks averaging P/E ratios of less than 11.
In contrast, the three worst-performing baskets were also those with the highest P/E ratios (mostly above 30). Those three baskets underperformed the average stock by an average of more than 2% in rolling 12-month periods since 2004. We saw similar trends using trailing P/E and estimated current-year P/E.
A similar analysis of the S&P 500, S&P MidCap 400, and S&P SmallCap 600 indexes found that P/E on next-year earnings worked better than the other ratios in all three indexes. However, P/E as a whole did not work as well for large-cap stocks.
At the moment, our Buy List contains few super-cheap stocks, in part because large-caps trade at higher valuations than smaller stocks, and in part because growth stocks currently average higher Quadrix® Overall scores than value stocks. As of June 16, S&P 500 Index stocks traded at an average of 20 times expected next-year earnings, while only 90 stocks (18% of the index) traded below 11 times earnings. In contrast, stocks in the S&P MidCap 400 and SmallCap 600 indexes averaged P/E ratios of 16, with 344 (34% of the combined indexes) trading below 11 times earnings.
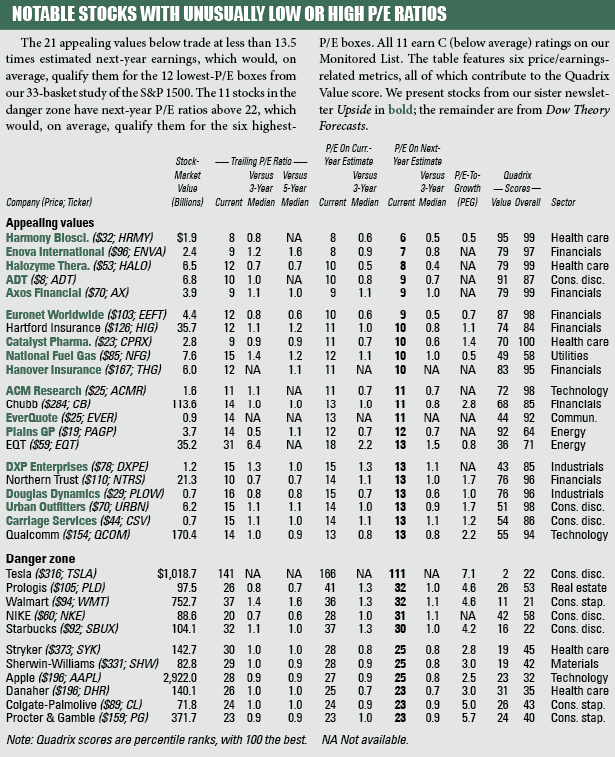
Below, we present a few appealing values, as well as some highly hyped stocks trading in the danger zone.